Calibration – Tolerances and measurement results
Introduction
When customers are asking ISO/IEC 17025 certified calibration laboratories for providing calibration reports for Danisense current transducers, it is important that customers make an active decision about whether the calibration reports should only state the measured accuracy of the current transducer, or it is also desired to provide Statements of conformity to certain specifications based on predefined decision rules. In the later case, the ISO/IEC 17025 standard is clear on the requirements for the calibration laboratory:
“When the customer requests a statement of conformity to a specification or standard for the test or calibration, the specification or standard and the decision rule shall be clearly defined. Unless inherent in the requested specification or standard, the decision rule selected shall be communicated to, and agreed with, the customer.”
At Danisense we think that in the cases when Statements of conformity is required as per above paragraph, it is important that the customer is actively involved in the definition of the tolerance specification in order to ensure that the calibration report brings the value that the customer is looking for. We can distinguish between these two cases:
- Statements of conformity for the current transducer are written with regard to the specific customer requirements originating from the customer application, or
- Statements of conformity for the current transducer refer to the general datasheet specifications
In both cases, if customers have actively decided on specifications to be used for the Statements of conformity for the transducer, they can also use these numbers to choose a calibration laboratory which can provide calibration uncertainties much lower than the calculated specifications required by their application. Latter will help avoiding that the predefined decision rules lead to inconclusive Statements of conformity.
The sections below will describe how to calculate the tolerance specifications based on general datasheet data, in case that customer cannot provide specifications originating from the particular current transducer application.
Device configurations for Calibration
There are basically three different device configurations that can be calibrated.
- Current transducer with current output
- Current transducer with voltage output
- Current transducer with current output + DaniSense System Interface Unit (DSSIU) with Voltage Output Module (VOM)
The configuration options are described in the following article, as well as in the manual:
Current transducer with current output
Calibration laboratories often offer the customer between 5 and 10 measurement points. However, there is no standard in this respect, so the customer is free to choose the measuring points. There are only the technical boundary conditions of the laboratory equipment to consider.
Once the current values to be tested have been determined, the accuracy can be calculated according to the datasheet. The accuracies for the DS200ID current sensor are calculated below. The required values can be found on page 2 of the data sheet.
The required parameters are marked in red in the following figure. The accuracy calculation is carried out below for a DC signal.
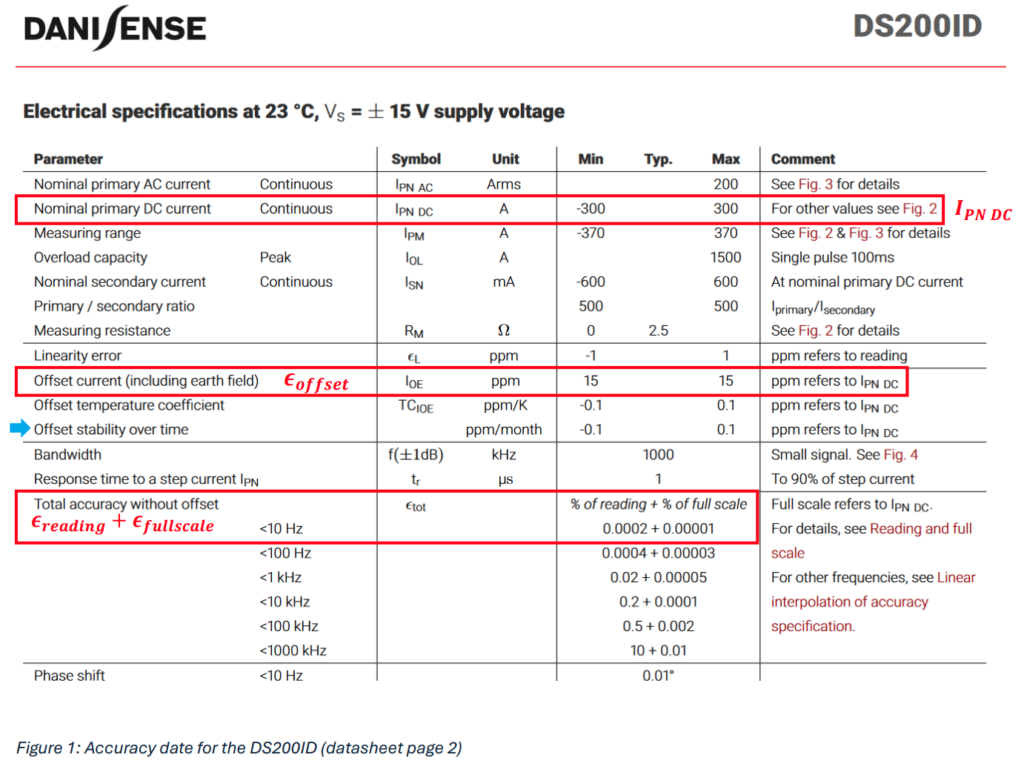

The following absolute error results for 15 A or 5 % of the primary rated current DC:

With this formula it is possible to calculate the absolute error in mA for all test points. The tolerance can also be defined as a percentage error

Current transducers based on Danisense proprietary flux-gate technology are quite robust and durable products, but stress and aging of the physical materials during usage can marginally affect the performance in the longer run. When calibrating used devices, these ageing processes can be included in the tolerance limits. Offset stability over time
can be found in the data sheet. This parameter can also be added to the absolute error value 𝜖𝑡𝑜𝑡. This results in a corresponding calculation formula.

It is certainly unlikely that the “Stability over time” parameter will only move in one direction with the specified maximum and thus generate the largest possible error. For this reason, some users only take this parameter into account with a calculated probability. However, the above formula can be used to calculate the worst-case scenario according to the datasheet.
In order to ease communication with the calibration laboratories, the customer should define his own required tolerance values and specify them in the order for the calibration laboratory. If the measured values are within these relevant tolerance values, the customers can continue to use the current transducer in their application.
Current transducer with voltage output
In order to provide a voltage output directly out of the housing of the current transducer, a Voltage Output Module (VOM) is installed directly in the housing. The voltage signal can be connected to the respective measuring instrument at the BNC socket using a standard BNC cable.
Current transducers with voltage output generally have slightly higher error values due to the additional – conversion of the secondary current to voltage output signal in the current transducer itself, which otherwise would need to be performed on the user side with about the same accuracy degradation . The built-in measuring resistor also leads to the possibility that the ratio error values may increase over time due to physical component drift.

In the data sheet, these additional ageing processes are specified with the parameter “Ratio stability”. Therefore, if a device that has already been used by the customer for a certain period of time needs to be calibrated, this parameter should also be taken into account when calculating the error tolerances.
For new devices, the same procedure can be used as for current transducers with current output.
Formula for calculating the error limits for new devices with voltage output:

Formula for calculating the error limits of used devices with voltage output:

As described at the end of the previous chapter, this is a worst-case scenario. It is up to the customer to decide which tolerance values they require and how they take the “Offset stability over time” and “Ratio stability” parameters into account. The above formula is the worst-case scenario according to the data sheet.
Current transducer with DaniSense System Interface Unit (DSSIU)
In this configuration the Voltage Output Module (VOM) is located in the DSSIU-6-1U-V. The voltage output is provided via the mini XLR socket (3).

In principle, the VOMs in the DSSIU-6-1U-V can be calibrated without an associated current transducer. For this purpose, a current signal is applied to the test item via the D-SUB connection, which corresponds to the current output signal of the current transducer to be used. The test points are agreed with the customer in advance.
The tolerance values for the implemented modules can be found in the DSSIU-6-1U-V data sheet. Again, be aware of the component drift in VOMs and therefore make sure that the stability over time has been taking into account for the tolerance calculations.

Please note that the parameters specified here refer to the following values.
Offset error | ppm refers to IPN DC
Ratio error | ppm refers to reading
However, calibration of the current transducer in conjunction with the system unit is recommended. This calibrates the entire current measurement chain up to the measuring instrument. In this case, the current transducers are assigned to the individual channels.
Calibration measurements and results
For some applications, declarations of conformity are required. In this case, the customer sends the current transducers to a testing laboratory accredited according to IEC 17025 that offers corresponding accuracy measurements. In principle, it is up to the customer to define the required tolerance limits (accuracy values to be met). Often, the tolerance limits are calculated according to the data sheets of the current transducers for the individual measuring points and documented in the respective declarations of conformity as a basis for decisionmaking.
Every testing laboratory accredited according to IEC 17025 must also indicate the measurement uncertainty that exists for the individual measuring points. Accordingly, the measured values are often displayed graphically with the associated measurement uncertainty.

The diagram above shows that only measurement A has a 100% probability of being within the tolerance limits. In the case of measurement B, there is a potential risk that the measured value may also be outside the tolerance limit due to the large measurement uncertainty. This means that an incorrect decision regarding conformity may be made.
In order to make this visible in the evaluation of the measurement results, “non-binary statements” have been introduced. Thus, measurement result B from the above illustration can be evaluated with a “Conditional Pass” instead of a “Pass”. This designation makes it immediately clear that the measurement result contains a residual probability that the current transducer is outside the tolerance limits after all.
Often, the measurement uncertainties are greater than the calculated tolerance limits of the current transducer. This can lead to “Conditional Fail” evaluations. There is often a high probability that the current transducer will be within the tolerance limits according to the data sheet specifications, despite this evaluation, due to the lower measurement uncertainties in other calibration laboratories.
In order to obtain clear binary evaluations from laboratories whose measurement uncertainties are considered high in relation to the tolerance limits, Danisense recommends taking the measurement uncertainties into account when calculating the tolerance limits.
This recommendation is best illustrated by a real example. For example, a DC calibration report of the DS600ID contains the following measurement results.

The measured deviation from and including 20 % of the rated primary current is above the determined datasheet tolerance. In the above mentioned formulars for calculating the total accuracy of the current transducer we received a result in A. It is very common for the deviation to be given in % of the measured value Ireading. With the following formulas it is possible to calculate the positive and negative maximum tolerance values in %.
Maximum tolerances in % of Ireading according to the datasheet:


The datasheet tolerance can now be added with twice the measurement uncertainty of the laboratory in both directions of the Y axis. The formulas are as follows.

For a better overview, it is useful to display the measured deviation with the calculated measurement uncertainty. For the sake of completeness, the formulas should also be mentioned here.

The following diagram shows the measurement values of the current transducer DS600ID that were evaluated as “Conditional Fail” by the calibration laboratory from 20% onwards of the nominal current. The red crosses are outside the calculated tolerance values. However, the measurement uncertainties are to be evaluated as high in relation to the tolerance limits.

The tolerance limits in dark blue for the current transducer were each increased by twice the measurement uncertainty of the laboratory for the respective measurement points. The horizontal green bars represent the adjusted tolerance limits. The calibration laboratory is now able to make clear binary statements.
Special aspects of AC calibration
The calculation of the accuracy of AC signals is according to the same scheme, even if the calculation formula for the total error contains DC and AC rms values.